Reusing the Interactive Map
A guide to adapting the Woodberry Down map for other purposes
Woodberry Down Community Organisation — wdco.org.uk
Overview
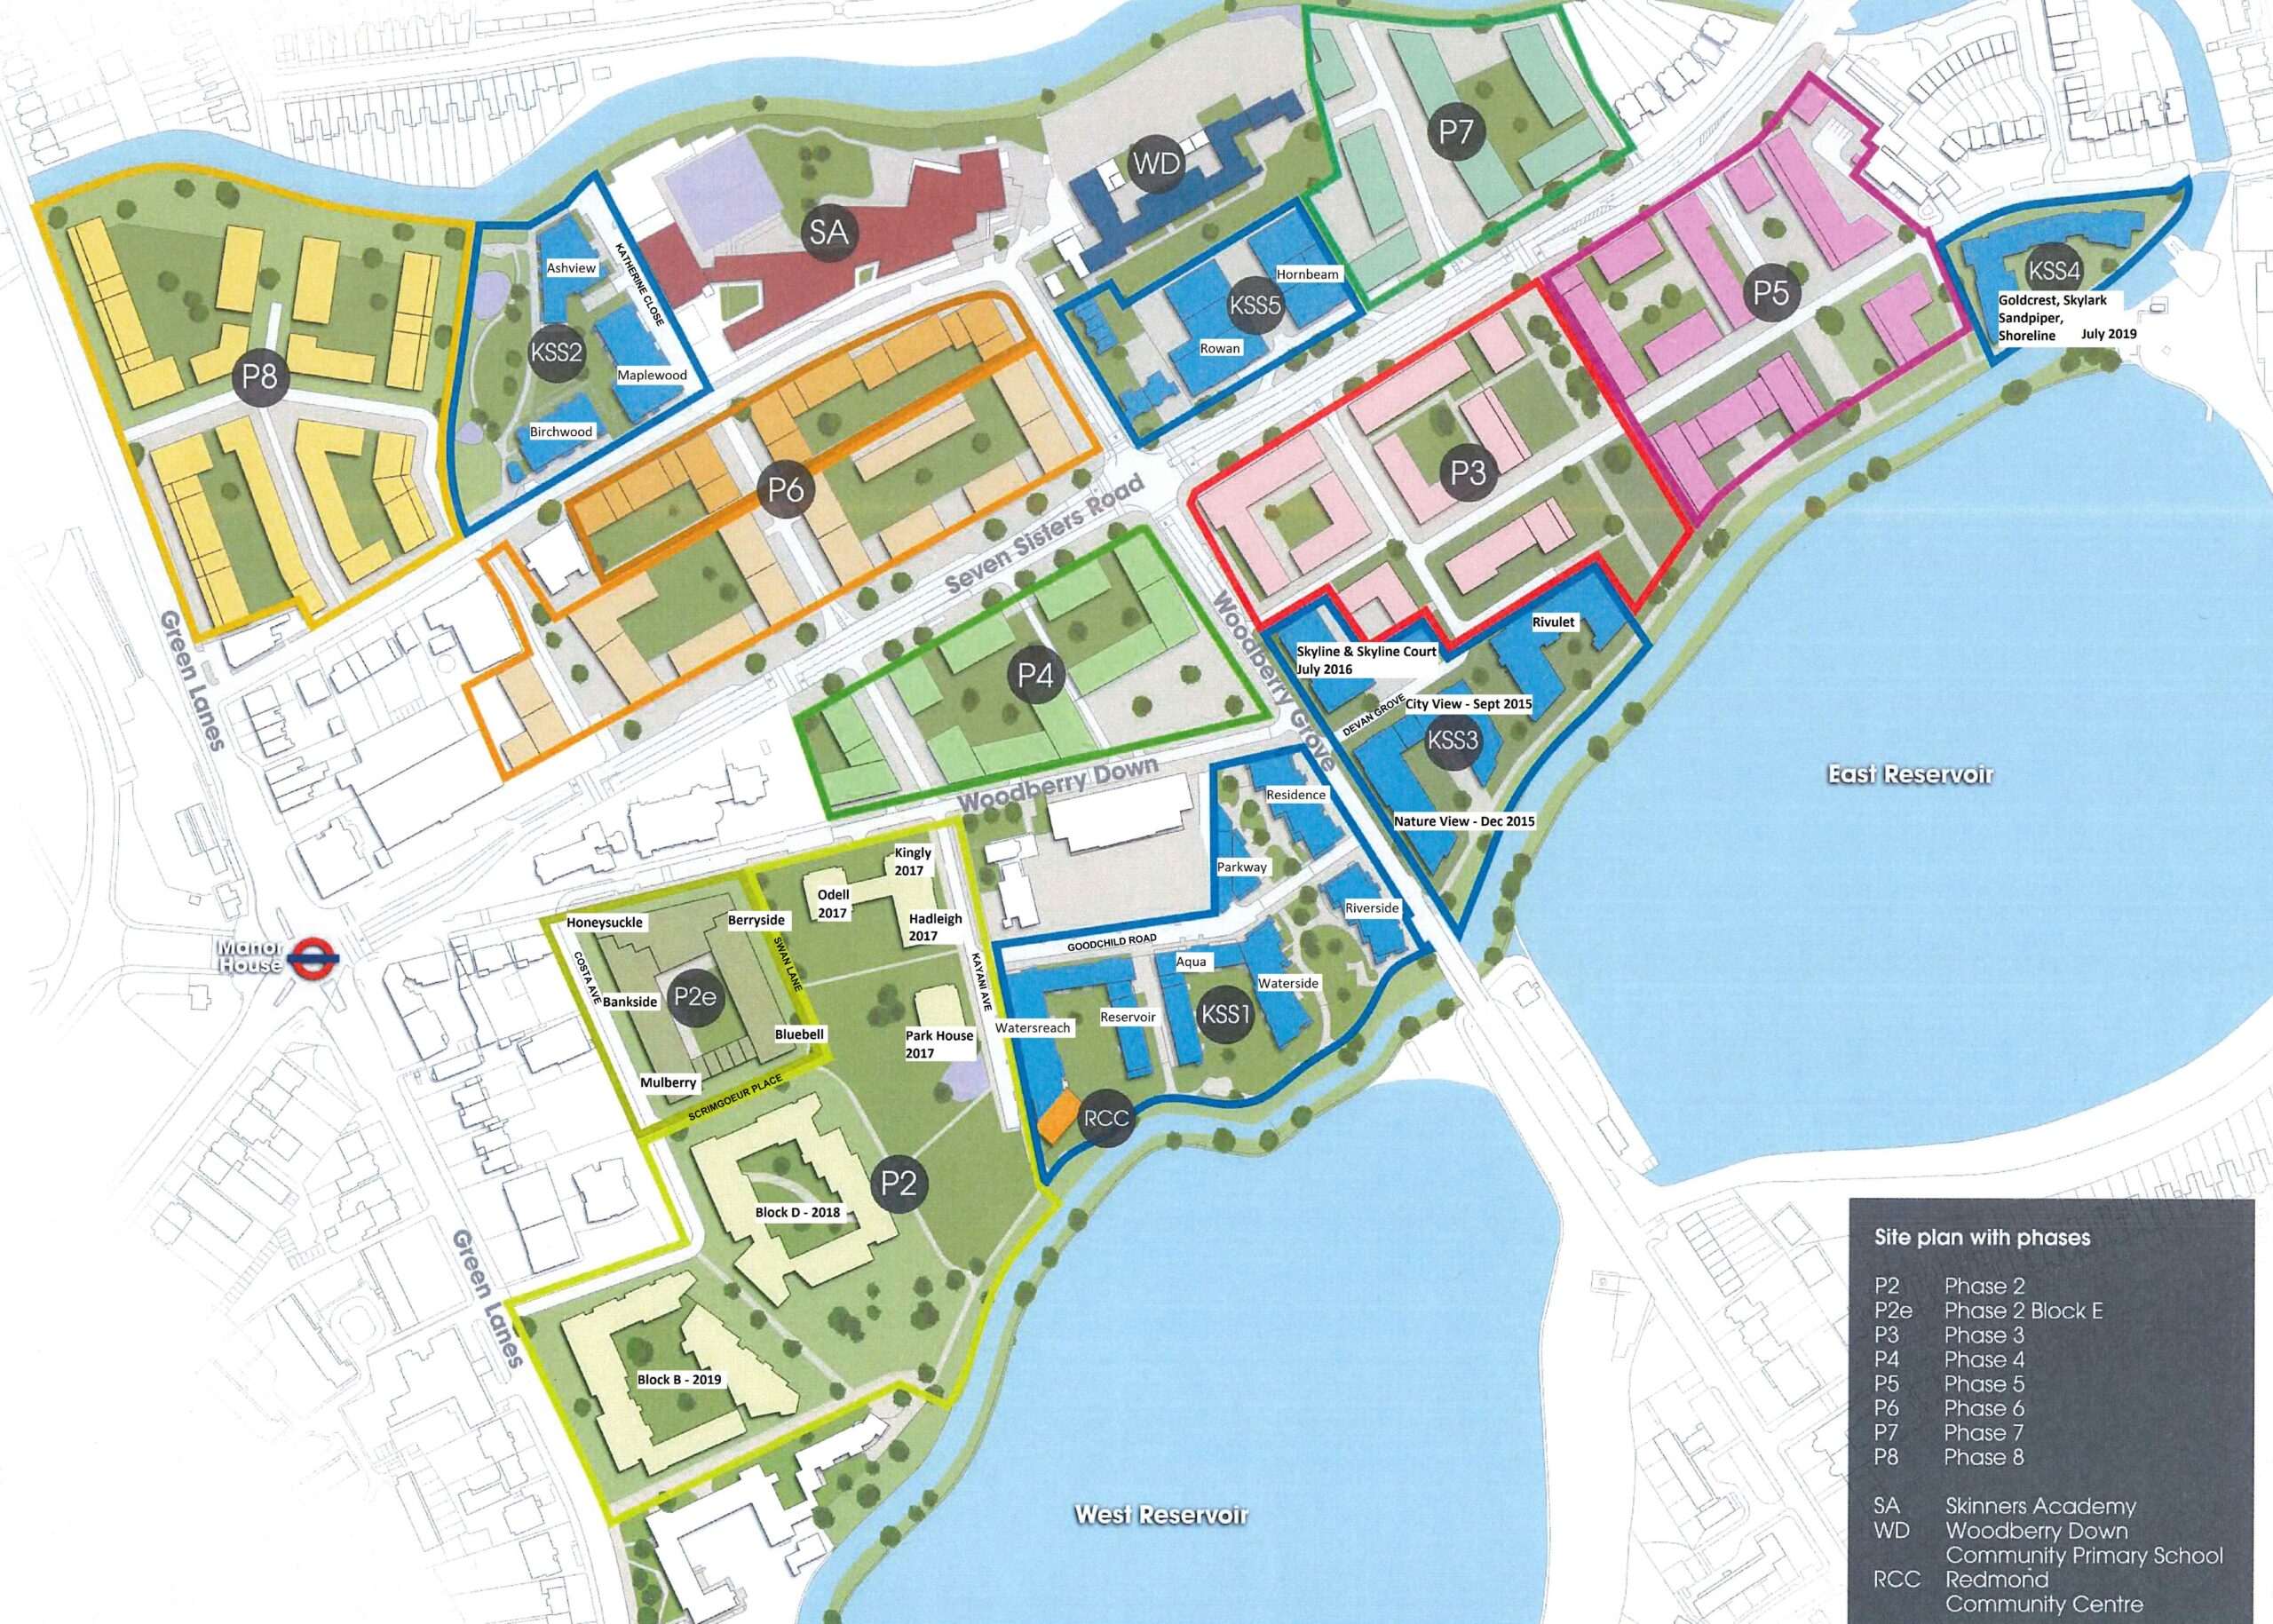
The interactive map is a single self-contained HTML file. It displays a background map image, overlays clickable markers on it, and shows a sidebar list that cross-references those markers. Hovering or tapping any item — whether on the map or in the list — highlights the corresponding location and shows a tooltip.
The same code can be reused for any purpose that involves placing named locations on a map image: businesses on the estate, community facilities, public art installations, walking routes, and so on. This document explains how to do that.
How the file is structured
The file has three parts that work together.
1. The map image
Where it appears: a single <img> tag near the top of the file.
The background image is loaded from a URL. It can be any image — a map, a floor plan, a site diagram — provided it is accessible from wherever the page is being served.
2. The SVG overlay
Where it appears: immediately after the <img> tag, inside the same container.
An invisible SVG layer sits exactly on top of the image. It contains one marker group (a <g> element) for each location. Each marker consists of two circles sharing the same centre point: the visible magenta ring, and a second ring used for the pulsing animation when that location is active.
The position of each circle is set by two numbers: cx (horizontal) and cy (vertical), expressed in SVG units. The SVG viewBox is 2560 wide by 1829 tall, matching the pixel dimensions of the original map image. Every other map image will have different dimensions and will need its own viewBox and its own coordinate measurements.
3. The data object
Where it appears: at the top of the <script> section, near the bottom of the file.
This is the only part of the file that normally needs editing. All location names, descriptions, and groupings live here in one place. The code reads this object and uses it to build both the map tooltips and the sidebar list automatically. There is no need to enter any information twice.
The data object in detail
The object is called GROUPS. It is an array of group objects, each of which has a heading and a list of entries. Here is a simplified example:
const GROUPS = [
  {
    heading: 'Phases',
    entries: [
      {
        id:        'p2',
        label:     'Phase 2',
        buildings: ['Odell', 'Kingly', 'Hadleigh'],
        note:      ''
      },
      {
        id:        'p2e',
        label:     'Phase 2E',
        buildings: ['Honeysuckle', 'Berry Side', 'Blue Bell'],
        note:      'aka Pewsham'
      }
    ]
  }
];
Fields
| Field | Example | Purpose |
|---|---|---|
id | 'p2' | A short unique identifier. Must match the data-id on the SVG marker and the popover div id (without the -label suffix). No spaces. Case-sensitive. |
label | 'Phase 2' | The display name shown in bold in the sidebar and in the tooltip. |
buildings | ['Odell', 'Kingly'] | An array of sub-item names — buildings, businesses, facilities, or whatever is relevant. Use an empty array [] if there are none yet. |
note | 'aka Pewsham' | An optional short note shown in italics. Useful for alternative names, brief descriptions, or status information. Use an empty string '' if not needed. |
Adapting the map for a new purpose
The example below explains how to adapt the file to show businesses on the estate rather than development phases. The same steps apply to any other purpose.
Step 1 — Choose or prepare your map image
The map image can be any image that is publicly accessible via a URL. Note its pixel dimensions: you will need them in Step 3.
In the file, find:
<img src="https://wdco.org.uk/..." ...Replace the URL with the URL of your new image.
Step 2 — Update the page title
In the file, find:
<h1>Woodberry Down — Site Map</h1>Replace the text with an appropriate title for your new map.
Step 3 — Update the SVG viewBox
In the file, find:
<svg viewBox="0 0 2560 1829" ...Replace 2560 and 1829 with the pixel width and height of your new map image. This ensures that the coordinate system used to place markers matches the image dimensions exactly.
Step 4 — Find the coordinates of your locations
Each marker is positioned by a pair of numbers (cx, cy) in the SVG coordinate system. Because the viewBox matches the image dimensions, these numbers are simply the pixel coordinates of the location on the image.
The easiest way to find them is to open the image in any image editor (even the Windows Photos app or Preview on a Mac) and hover over the point where you want to place a marker. The application will show you the x and y pixel coordinates. Note these down for each location.
Step 5 — Add SVG marker groups
For each new location, add a marker group to the SVG. The pattern is:
<g class="hotspot" data-id="MY_ID" popovertarget="MY_ID-label">
  <circle cx="1234" cy="567" r="40"
          fill="transparent" stroke="magenta" stroke-width="12"/>
  <circle class="pulse-ring" cx="1234" cy="567" r="40"/>
</g>
Replace MY_ID with a short unique identifier for this location (no spaces). Replace 1234 and 567 with the coordinates you found in Step 4. Keep everything else exactly as shown.
Also add an empty popover div for each location, in the section below the SVG:
<div id="MY_ID-label" popover class="map-popup"></div>MY_ID must be the same in both the <g> element and the <div> id (with -label appended). The code fills in the content of these divs automatically from the data object.
Step 6 — Update the data object
This is the only ongoing editing task. Replace the contents of GROUPS with your new data. For a businesses map it might look like this:
const GROUPS = [
  {
    heading: 'Food and Drink',
    entries: [
      { id: 'cafe1',  label: 'The Reservoir Cafe',
        buildings: [], note: 'Open Mon–Fri 8am–4pm' },
      { id: 'shop2',  label: 'Green Lane Grocers',
        buildings: [], note: '' },
    ]
  },
  {
    heading: 'Services',
    entries: [
      { id: 'gp1',    label: 'Woodberry Down Health Centre',
        buildings: [], note: '' },
    ]
  }
];
The heading field sets the section heading in the sidebar. The id must match the data-id in the SVG and the popover div. The label is displayed in bold. The buildings array can hold any list of sub-items — opening times, services offered, contact details, or anything else. The note field is for a short italic annotation.
Renaming the ‘buildings’ field
The field is called buildings for historical reasons. For a businesses map you might prefer to think of it as items or details. You can rename it throughout the file safely, as long as you change every occurrence consistently. There are three places where the name appears in the script:
// In the GROUPS data:
  buildings: ['item one', 'item two'],

// Where popovers are built:
  if (e.buildings.length)  html += ' ' + e.buildings.join(', ');

// Where the sidebar is built:
  if (e.buildings.length)  parts.push(e.buildings.join(', '));
Rename all three and the file will continue to work as before.
Removing the existing markers
If you are building a completely new map rather than adding to the existing one, you will want to remove all the current markers. There are three places to edit:
- The SVG section: delete all the
<g class="hotspot" ...>blocks. - The popover section: delete all the
<div id="...-label" popover ...>blocks. - The GROUPS data object: replace the contents with your new data.
Leave everything else in the file untouched. The CSS, the layout, the JavaScript functions, and the sidebar structure will all continue to work correctly with the new data.
Letting Claude do it from a CSV
If you have many locations to add, the most efficient approach is to prepare a CSV file and let Claude make all the changes in one operation.
CSV format
id,label,group,note,items,cx,cy
cafe1,The Reservoir Cafe,Food and Drink,Open Mon-Fri 8am-4pm,,1234,567
shop2,Green Lane Grocers,Food and Drink,,,987,432
gp1,Woodberry Down Health Centre,Services,,GP surgery,654,890
Columns
| Column | Required | Notes |
|---|---|---|
id | Yes | Short unique identifier, no spaces |
label | Yes | Display name shown in bold |
group | Yes | Sidebar section heading; entries with the same group name are gathered together |
note | No | Short italic annotation; leave blank if not needed |
items | No | Sub-items separated by a pipe character | — e.g. Monday 9am|Tuesday 10am; leave blank if not needed |
cx | Yes | Horizontal pixel coordinate of the location on the map image |
cy | Yes | Vertical pixel coordinate of the location on the map image |
How to use it
Supply Claude with two things: the current HTML file and the CSV file. Ask Claude to update the map from the CSV. Claude will update the GROUPS data object, add all the SVG marker groups, and add all the popover divs — without you needing to touch the code.
When new businesses open or existing ones close, update the CSV and repeat the process.
Browser compatibility
The map uses the Popover API for the tooltips that appear when hovering on the map circles. This requires a reasonably up-to-date browser. The following are confirmed to work:
- Google Chrome (any recent version)
- Microsoft Edge (any recent version)
- Safari 17 and later
- Firefox 125 and later
- Comet (Perplexity’s browser, Chromium-based)
- Android Chrome
Users on older browsers will see the map and the sidebar but the tooltips on the map circles may not appear. A note on the page advising visitors to use an up-to-date browser is a reasonable precaution.
Note on Comet specifically: Comet injects a toolbar above the page that can displace SVG coordinates if standard browser measurement methods are used. The current code uses offsetWidth and offsetHeight rather than getBoundingClientRect() to avoid this. Any future modifications to the coordinate calculation should preserve this approach.
Quick reference: what to change for a new map
| What | Where in the file | Notes |
|---|---|---|
| Map image URL | <img src="..."> | Replace with URL of your new image |
| Page title | <h1>...</h1> | Replace with your title |
| SVG viewBox dimensions | <svg viewBox="0 0 W H"> | Match the pixel size of your new image |
| Marker positions | <circle cx="..." cy="..."> | Pixel coordinates of each location on the image |
| Marker IDs | data-id="..." and id="...-label" | One unique ID per location, used in both places |
| Location data | const GROUPS = [...] | The only place you need to edit for content changes |
Woodberry Down Community Organisation · wdco.org.uk